Showing posts with label statistics. Show all posts
Wednesday, November 28, 2012
Saturday, November 24, 2012
Reƫle huizenprijzen
Huizenprijzen in Nederland, gecorrigeerd voor inflatie,
VS en Nederland,
En de prijzen aan de Herengracht, Amsterdam, in bijna drie eeuwen,
VS en Nederland,
En de prijzen aan de Herengracht, Amsterdam, in bijna drie eeuwen,
Monday, August 13, 2012
Annom seems to be right and it's a good thing
Very interesting report. Atheism on the rise.
The WIN-Gallup International ‘Religion and Atheism Index’ which measures global self-perceptions on beliefs is based on interviews with more than 50,000 men and women selected from 57 countries across the globe in five continents. The survey also provides trend data for shifts in attitudes since 2005.Interesting fact, China is the most atheist country in the world:
14% religious, 30% non-religious, 47% convinced atheist, 9% don't know / no response
Thursday, January 26, 2012
Sugar Stacks
Ever wondered how much sugar is in your food? Sure, you can read the label and the amount of sugar inside your food, but this doesn't tell you how much this looks like.
Sugar Stacks is a website where sugar cubes are used to visualize the amount of sugar. Check out the amount of sugar cubes you're consuming everyday on Sugar Stacks
Monday, September 12, 2011
America can't be considered a civilized country - Part IV
See parts I - III of this series here. A bit from QI on American prisons.
Jimmy Carr keeps it quite funny, but these stats are very depressing, and they don't even mention the capital punishment, which out of all the OECD countries besides Japan (vary rarely) only the USA still uses.
See also the following wikilinks Prison-Industrial-Complex, Incarceration in the United States, Global Distribution of Capital Punishment. I would write more on the disgusting ways in which the prison industrial complex works, but I don't have the time to dig in and read all the articles for references.
Tuesday, June 14, 2011
Data porn
TED: Aaron Koblin: Artfully visualizing our humanity
Aaron Koblin's website
Johnny Cash project
The Mechanical Turk (we should think of a fun project to do with this)
Wednesday, June 08, 2011
Which Places Have the Most reddit Addicts? And Global reddit Meetup Day!
From the reddit blog:
Most addicted/engaged countries by avg. pageviews per visit (reddit's Google Analytics, Jan-May 2011):On June 25 there is a global reddit meetup, with one of the meeting places being Amsterdam. I'm seriously thinking of going, anyone with me?Canada: 15.72 United States: 15.46 Denmark: 13.99 Norway: 13.81 Sweden: 13.34 Netherlands: 12.89 United Kingdom: 12.86 Ireland: 12.57 Belgium: 11.98 Finland: 11.27
Tuesday, May 10, 2011
40 stacks of books from Earth to Neptune
"Three years ago, the world's 27 million business servers processed 9.57 zettabytes, or 9,570,000,000,000,000,000,000 bytes of information.
Researchers at the School of International Relations and Pacific Studies and the San Diego Supercomputer Center at the University of California, San Diego, estimate that the total is equivalent to a 5.6-billion-mile-high stack of books stretching from Earth to Neptune and back to Earth, repeated about 20 times.
By 2024, business servers worldwide will annually process the digital equivalent of a stack of books extending more than 4.37 light-years to Alpha Centauri, according to a report compiled by the scientists.
(...)
As large as the numbers may seem, the three scientists who worked on the report stated that their server workload figures may be low because server industry sales figures don't fully account for the millions of servers built in-house by Google, Microsoft, Yahoo and other companies using individual component parts ." - read more...
Friday, March 25, 2011
Comparing deaths from energy production
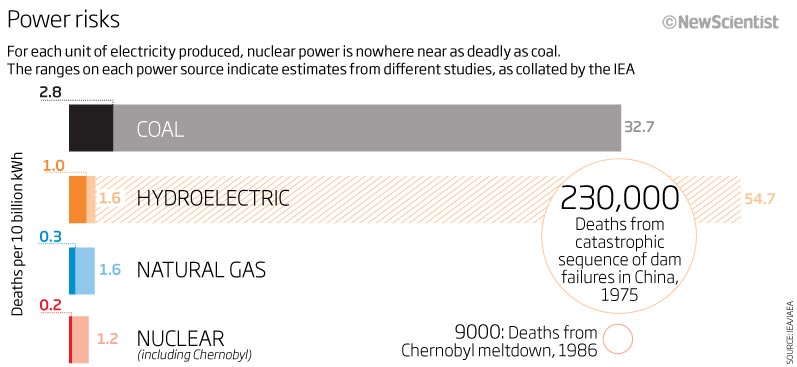
This diagram from a NewScientist article shows how fossil fuels are far deadlier than nuclear.
A blogger has also compiled the following list which also includes renewable energy.
Energy Source - Death Rate (deaths per TWh)
Coal – world average - 161 (26% of world energy, 50% of electricity)Coal – China - 278
Coal – USA - 15
Oil - 36 (36% of world energy)
Natural Gas - 4 (21% of world energy)
Biofuel/Biomass - 12
Peat - 12
Solar (rooftop) - 0.44 (less than 0.1% of world energy)
Wind - 0.15 (less than 1% of world energy)
Hydro - 0.10 (europe death rate, 2.2% of world energy)
Hydro - world including Banqiao) - 1.4 (about 2500 TWh/yr and 171,000 Banqiao dead)
Nuclear - 0.04 (5.9% of world energy)
Wednesday, March 23, 2011
Friday, March 18, 2011
Rainbowboys profesion stats on Ngram viewer
NGRAM viewer let you see how often phrases have occurred in the world's books over the years. Google Books has scanned over 10% of all books ever published, and now you can grap the occurrence of phrases up to five words in length from 1400 through the present day right in your browser.
An example of this tools, our proffesions in one grap:

here some intresting grap:

Hydrology vs geology think the peeks in geology are the goldrushes. To bad for the hydrology that it only goes to 2000 and the global warming hype isn't in there yet.
Another intresting graph is the anal sex and the porno graph:

Thursday, March 17, 2011
Graphs of radiation levels in Japan
The graphs give the radiation level in µSv/hour. According to wiki the natural background radiation is 2.4 mSv/year, which is 0.27 µSv/hour.
It doesn't look too bad yet. See the rest of the graphs here. A graph of radiation risks for comparison:
Tuesday, February 01, 2011
Cairo Crowd Estimates
Let me first say that the real events in Egypt are much more interesting and important than this post and I support everyone on the streets there, but my thingy for numbers made me investigate the crowd estimates a bit more.
Al Jazeera is reporting up to 2 million people have gathered in Cairo's Tahrir square, some reporters even get extremely excited and say at least 2 million people have gathered. 2 million people is 40x the Lowlands festival!
This image shows one of the edges of the crowd, to get an idea of where the crowd ends,
Here is a visual overview of crowd densities. A density of 1-5 per square meter is possible, although 5 is extremely dense. Let's take 4 per square meter, which is already very high,
Now lets look at an area of 100,000 square meter in Cairo,
About 400,000 people could stand on this area, although 200,000-300,000 is probably more realistic if there are no naked women handed out for free in the centre. Also keep in mind that the full Washington Mall is 15x larger, 1.5 million square meter.
Even if we take the high estimate of 4 people per square meter, an area 5 times larger than the one shown above is required for 2 million people.
Too bad there are no good overview images (RC helicopters, where are you?!) so I can't make any serious estimate, but I would be surprised if "even" 1 million people are in and around the square. My guesstimate would be 100,000-400,000.
Still a lot of people, especially for Egypt, and I hope enough.
Al Jazeera is reporting up to 2 million people have gathered in Cairo's Tahrir square, some reporters even get extremely excited and say at least 2 million people have gathered. 2 million people is 40x the Lowlands festival!
This image shows one of the edges of the crowd, to get an idea of where the crowd ends,
Now lets look at an area of 100,000 square meter in Cairo,
About 400,000 people could stand on this area, although 200,000-300,000 is probably more realistic if there are no naked women handed out for free in the centre. Also keep in mind that the full Washington Mall is 15x larger, 1.5 million square meter.
Even if we take the high estimate of 4 people per square meter, an area 5 times larger than the one shown above is required for 2 million people.
Too bad there are no good overview images (RC helicopters, where are you?!) so I can't make any serious estimate, but I would be surprised if "even" 1 million people are in and around the square. My guesstimate would be 100,000-400,000.
Still a lot of people, especially for Egypt, and I hope enough.
Monday, January 03, 2011
List of Companies by Revenue
#201 - Ahold.
Almost #4 mr Wiggles :)
21 retailers are larger than Ahold.
Wal-Mart has 2 million employees, Ahold 200 thousand.
ING the largest financial fucktards in the world.
Almost #4 mr Wiggles :)
21 retailers are larger than Ahold.
Wal-Mart has 2 million employees, Ahold 200 thousand.
ING the largest financial fucktards in the world.
Friday, December 10, 2010
Global Corruption Barometer 2010
3% have paid a bribe in the Netherlands in the past year. 35% in Ukraine. 1 in 4 Earth citizens has paid a bribe in 2010. We are in that elite 25%.
Wednesday, December 08, 2010
rainbowboys label stats vizualiszations with IBM: "many eyes"
I found a nice site that can make some cooler visualizations than excel can. Check the site IBM many eyes. Too bad posting this flash didn't work on rainbowboys.org, so follow the link to see who made the most posts in witch category:
Also its very easy to make a flash cloud see link

Or a bubble chart, i wanted to make from every bubble a pie chart but that wasn't possible.
Friday, November 19, 2010
Rainbowboys label stats

I made some stats of the labels used in our blog.
Statistics:
We have 63 labels in total. Only 4 of them are linked to sex, namely: sex, porn, bizarre and weird shit.
Hitler is tagged more than history
Hitler is #41 on the highest labeling rate with 23 posts. Ahead of: sex, economics, cars, cult, global warming and way more labels
Cybrbeast posted at least once in every label
Cybrbesast posted in almost all labels the most, except for war, statistics, pseudosience, map, Holocaust, hitler, firefox, dutch, drugs, cult, zombie, weird shit, the fetishism book, rbb-mediatips, and cartoon. Annom and the pimp got the honor in these labels.
Software is the only label where only 2 people posted in (cybr and annom)
Only in 5 labels (Humor, Bizare, Stupid, Dutch and relgion) all of us made at least one post.
Cybrbeast, Dekus and the Pimp posted the most in Humor with 141, 64 and 45 posts respectively.
Annom posted the most in photography with 57 posts
Douche posted the most in what "he named" art
Kamielkaze posted the most in architecture
Tommy posted the most in religion and art
Tuesday, September 21, 2010
Segregation Map US Cities
Red is White, Blue is Black, Green is Asian, and Orange is Hispanic, and each dot is 25 people. Data from Census 2000.
Chicago
Detroit
New York
San Fransisco, Oakland, Berkeley
Chicago
Detroit
New York
San Fransisco, Oakland, Berkeley
Sunday, September 05, 2010
Subscribe to:
Posts (Atom)


