McClane takes Farrell to the FBI headquarters in Washington, D.C., where Farrell is questioned. FBI director Miguel Bowman (Cliff Curtis) is uninterested in his surmise: Farrell believes that the terrorists are mounting a "fire sale" (where "everything must go") attack, taking advantage of the vulnerability of the nation's computer-controlled infrastructure.A more detailed description of Stuxnet @ wikipedia. Scary shit.
Thursday, March 31, 2011
 Stuxnet: 21st-century cyber weapon of mass destruction
Out of all over-the-top movies, Stuxnet actually makes the Die Hard 4.0 scenario less unrealistic:
Tuesday, March 29, 2011

Monday, March 28, 2011
 Flocking Starlings
Festo SmartBird
Here is the inside:
Festo was featured before on the blog with their uber sleek flying helium penguins.
Saturday, March 26, 2011
Man vs Robot - Earl, the Robotic Bowler
EARL, the Enhanced Automated Robotic Launcher
It's a fun contest but I think before you can really say machines > humans, the machines will have to operate at human scale and not as these huge powered robotics system.
Friday, March 25, 2011
Comparing deaths from energy production
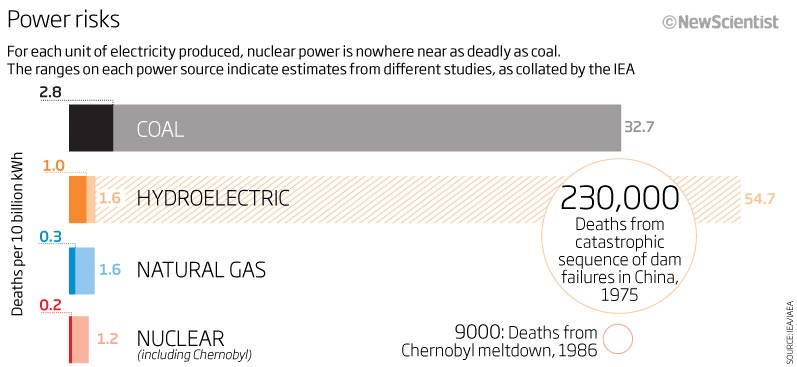 This diagram from a NewScientist article shows how fossil fuels are far deadlier than nuclear.
A blogger has also compiled the following list which also includes renewable energy.
Energy Source - Death Rate (deaths per TWh)
Coal – world average - 161 (26% of world energy, 50% of electricity)
This diagram from a NewScientist article shows how fossil fuels are far deadlier than nuclear.
A blogger has also compiled the following list which also includes renewable energy.
Energy Source - Death Rate (deaths per TWh)
Coal – world average - 161 (26% of world energy, 50% of electricity)Coal – China - 278
Coal – USA - 15
Oil - 36 (36% of world energy)
Natural Gas - 4 (21% of world energy)
Biofuel/Biomass - 12
Peat - 12
Solar (rooftop) - 0.44 (less than 0.1% of world energy)
Wind - 0.15 (less than 1% of world energy)
Hydro - 0.10 (europe death rate, 2.2% of world energy)
Hydro - world including Banqiao) - 1.4 (about 2500 TWh/yr and 171,000 Banqiao dead)
Nuclear - 0.04 (5.9% of world energy)
Thursday, March 24, 2011
 Twist and Brush
 Twist and Brush is a toothbrush that incorporates a toothpaste deposit. Simple and smart, me like specialy for vacation.
Wednesday, March 23, 2011
Friday, March 18, 2011
Rainbowboys profesion stats on Ngram viewer
NGRAM viewer let you see how often phrases have occurred in the world's books over the years. Google Books has scanned over 10% of all books ever published, and now you can grap the occurrence of phrases up to five words in length from 1400 through the present day right in your browser.
An example of this tools, our proffesions in one grap:

here some intresting grap:

Hydrology vs geology think the peeks in geology are the goldrushes. To bad for the hydrology that it only goes to 2000 and the global warming hype isn't in there yet.
Another intresting graph is the anal sex and the porno graph:

First spacecraft ever to orbit Mercury

...
NASA's spacecraft called Messenger successfully veered into a pinpoint orbit Thursday night after a 6 1/2-year trip and 4.9 billion miles and tricky maneuvering to fend off the gravitational pull of the sun. It is the fifth planet in our solar system that NASA has orbited, in addition to the Earth and the moon.
...
"It was right on the money," Messenger's chief engineer, Eric Finnegan, said. Messenger is in orbit that brings it as close as 120 miles above the planet's surface. "This is as close you can possibly get to being perfect."
Mercury is not only difficult to get to, but it's has some of the most extremes in the solar system. Temperatures there swing wildly by 1,100 degrees.
...
Messenger, which cost NASA $446 million, was launched in 2004. Next month it should start transmitting pictures and investigate Mercury's mysterious magnetic field and unusual density." - read more...
Thursday, March 17, 2011

Graphs of radiation levels in Japan
The graphs give the radiation level in µSv/hour. According to wiki the natural background radiation is 2.4 mSv/year, which is 0.27 µSv/hour.
 It doesn't look too bad yet. See the rest of the graphs here. A graph of radiation risks for comparison:

 It doesn't look too bad yet. See the rest of the graphs here. A graph of radiation risks for comparison:

Wednesday, March 16, 2011
impressive scaffolding


Tuesday, March 15, 2011

Sunday, March 13, 2011

Saturday, March 12, 2011
Friday, March 11, 2011
 The Don't Care Bears

Just something random that I found and find pretty cool. This is what I'll visualize in my head everytime I think "Care Bear" now. End of message. You probably #carebear.
Oh yeah, out of bi-directional courtesy, if you click the title you'll be taken to the T-shirt shop I found this at. You've been warned.
Oh yeah, out of bi-directional courtesy, if you click the title you'll be taken to the T-shirt shop I found this at. You've been warned.
Monday, March 07, 2011
Christopher Hitchens, still outrageous
One of my heroes. I hope, but doubt, he will get remission from his cancer.
Saturday, March 05, 2011

Thursday, March 03, 2011
Wednesday, March 02, 2011
Global average NDVI over time
Plants strongly absorb red light and are highly reflective in infrared which keeps them from overheating. Other earthly surfaces don't show this behavior. NDVI (Normalized Difference Vegetation Index) is based is based on the ratio of measured near-infrared and red light and therefor is a strong indicator of vegetation density and health. This is a sequential slideshow I made of the bi-monthly global NDVI data averaged over the years 1981-2008. It plays from January to December (I should have added the months in the video) and you can clearly see the vegetation react to the seasons. The raw data comes from NASA GIMMS. From these maps in combination with a global map of vegetation types one can calculate other vegetation parameters such as the Leaf Area Index in my case. LAI is the area of leaves per area of ground and is an important parameter in hydrology because it intercepts and stores rainwater and transpirates water which plants extract from the soil. The maps I generate will then be used in a hydrological model to see how it performs with respect to the current LAI implementation which uses standard vegetation 'curves'. This is the main subject of my thesis.If you want to see the maps in higher resolution you can download the PNGs here.
 This is a sequential slideshow I made of the bi-monthly global NDVI data averaged over the years 1981-2008. It plays from January to December (I should have added the months in the video) and you can clearly see the vegetation react to the seasons. The raw data comes from NASA GIMMS. From these maps in combination with a global map of vegetation types one can calculate other vegetation parameters such as the Leaf Area Index in my case. LAI is the area of leaves per area of ground and is an important parameter in hydrology because it intercepts and stores rainwater and transpirates water which plants extract from the soil. The maps I generate will then be used in a hydrological model to see how it performs with respect to the current LAI implementation which uses standard vegetation 'curves'. This is the main subject of my thesis.If you want to see the maps in higher resolution you can download the PNGs here.
 Charlie Sheen v Muammar Gaddafi: whose line is it anyway?

The US actor and the Libyan leader have produced some choice lines recently.
Can you distinguish between them? Take the quiz here.
My score was 8 out of 10 correct.
Subscribe to:
Posts (Atom)